INDEX
– GORISK Eruption Report n°7 – 6th June 2012 (final summary)
– GORISK Eruption Report n°6 – 7th December 2011
– GORISK Eruption Report n°5 – 15th November 2011
– GORISK Eruption Report n°4 – 14th November 2011
– GORISK Eruption Report n°3 – 12th November 2011
– GORISK Eruption Report n°2 – 10th November 2011
– GORISK Eruption Report n°1 – 9th November 2011
(c) GORISK Scientific Network, 2011
———-
Information report n°7 – 6th June, 2012
Final summary
The last eruption of Nyamulagira volcano started on 6th November 2011, 5:55 PM (UTC+2) until April 2012. This eruption was located ± 12 km east-northeast of the Nyamulagira crater, close to one of the 1989 eruptive sites. A first fissure opened with a ~ East-West orientation, from which lava escaped, forming lava fountains and lava flows. After a week of eruption, the lava flows reached their maximum length of ~11.5 km. An elongated spatter-and-scoria cone (i.e. the western cone) formed along this fracture. In early December 2011, a new cone (the eastern cone) formed east to the first one, on a new eruptive fracture. The next days, the volcanic activity progressively migrated to this new volcanic edifice. During the 3 last months of the eruption, the eruptive activity was mainly represented by a temporary lava lake within the eastern cone. Lava flows were fed through lava tunnels, fresh lava being mainly visible during the night. The local population named the two new volcanic cones “Umoja” (western cone) and “Tuungane” (eastern cone). Our preliminary estimates for the 2011-12 eruption indicate a volume of emitted lavas of at least 81.5 x 10⁶ m3. These lava flows did not reach inhabited areas and only affected the vegetation of the Virunga National Park.

The previous eruption of Nyamulagira occurred 22 months earlier, in January 2010. The 2011-12 eruption is the biggest event of the volcano since the 1991-1993 eruption, which lasted nearly 1.5 years and emitted a lava volume estimated to ~ 131 x 106 m3 (Smets et al., 2010).
Starting from the end of February 2012, degassing occurred in the Nyamulagira’s caldera. The emission site is located inside the pit crater, but all fractures inside de caldera are degassing. On several occasions, sulfur smells reached the city of Goma due to unusual meteorological conditions.
———-
Information report n°6 – 7th December, 2011
Eruption summary
Nyamulagira volcano has started to erupt on 6th November 2011, 5:55 PM (UTC+2). This eruption is located ± 12 km east-northeast of the Nyamulagira crater, close to one of the 1989 eruptive sites. The previous eruption of this volcano occurred 22 months earlier, in January 2010. The eruptive fracture is oriented approximately East-West, perpendicularly to the rift direction. After a week of eruption, the lava flows reached their maximum length of ~11.5 km.
Information from optical satellite imagery
Optical images acquired during the second half of November 2011 do not allow a good observation of the Nyamulagira eruption due to important cloud cover. The Landsat 7 ETM+ image acquired on 21st November 2011 shows that the lava flow did not grow in length, but widened and developed new branches (Fig. 1).

Information from SAR satellite imagery
A new ENVISAT-ASAR radar image was acquired on 2nd December 2011. Comparison between pre- and post-eruptive radar images allowed us detecting and mapping part of the new lava flow, where it overlap the former 1989 lava flow (Fig. 2). A second branch is detected in the northern half part of the flow and a third smaller one has developed on the western side of the main flow (pink arrows on Fig. 3).

The surface change which is linked to the presence of the lava flow represents an area of about 14.7 x 10⁶ m². Assuming a mean thickness of 3 m, a common value for Nyamulagira, the estimated corresponding volume of lava is ~44 x 106 m³. This estimation based on coherence images only refers to part of the new lava flow that overlaps the former 1989 lava flow and is therefore underestimating the actual volume of the ongoing eruption.

———-
Information report n°5 – 15th November, 2011
Eruption summary
On 6th November 2011, 5:55 PM (UTC+2), Nyamulagira volcano has started to erupt after two days of intense seismic activity. This eruption is located ± 12 km east-northeast of the Nyamulagira crater, close to one of the 1989 eruptive sites. The previous eruption of this volcano occurred 22 months earlier, in January 2010. The eruptive fracture is oriented approximately East-West, perpendicularly to the rift direction.

Information from optical satellite imagery
ASTER, Hyperion and ALI images were acquired on November 12 and allow for the first time estimating the length of the lava flow. Within 6 days of eruption, the lava flow reached 11.5 km long. The path followed by lavas corresponds to the most western one suggested by the lava flow simulations (Fig. 2 and 3). On November 12, the lava flow front was located 5 km far from the road Kelengera-Tongo. According to the lava flow simulations, this road could be threatened by the lava flow.


Information about ground deformations
Satellite radar images acquired on November 11 revealed major ground deformation features associated to the eruption. It is actually the largest deformation ever detected by that method (InSAR) since the early 1990’s over that volcano.
Very preliminary estimation of the observed deformation signal suggest an affected area spreading over much more than 250 km2.
Under the pressure of the ascending magma, the ground rose up to more than 50 cm at the eruptive site where the spatter cone is developping. Another 15 cm deformation is detected within the Nyamulagira caldera accompanied with a deflation observed on the flanks. In contrast, no apparent deformation can be noticed on Nyiragongo until that image acquisition.
More detailed analysis is under way and additionnal satellite images are due for the coming days.
ACKNOWLEDGMENT
The GORISK scientific network would like to thank A.G. Davies1, D. Pieri1 and G. Vaughan2 for their help in acquiring ASTER, Hyperion and ALI images. A special thank to Sergey Samsonov3 for the production of the first SAR interferogram of the eruption.
1- Jet Propulsion Laboratory, USA
2- U.S. Geological Survey, USA
3- Canada Center for Remote Sensing, Canada
———-
Information report n°4 – 14th November, 2011
Pictures of the eruption
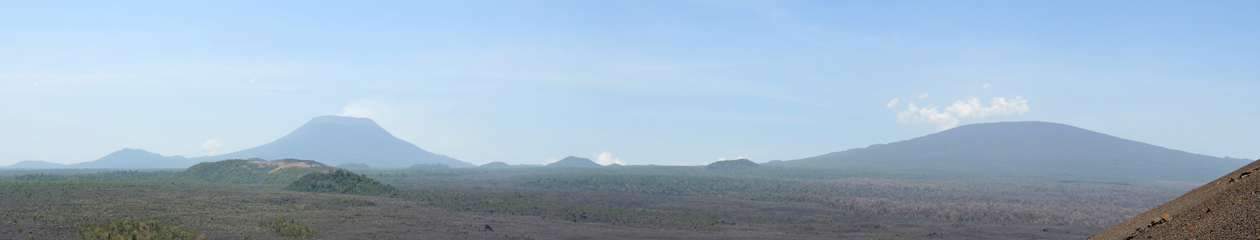
The Virunga National Park offers the possibility to see the new eruption of Nyamulagira through an overnight trek. Pictures of the newly created cone are available on its official website.
———-
Information report n°3 – 12th November, 2011
Eruption summary
On 6th November 2011, 5:55 PM (UTC+2), Nyamulagira volcano has started to erupt after two days of intense seismic activity. This eruption is located ± 12 km east-northeast of the Nyamulagira crater, close to one of the 1989 eruptive sites. The previous eruption of this volcano occurred 22 months earlier, in January 2010.
Information from lava flow modelling
The eruptive site was visited by scientists of the Goma Volcano Observatory on Nov. 11th allowing preliminary descriptions and GPS location.
Based on these parameters and the best available topography, simulation of lava flows invasion probability was calculated. Such simulation helps assess the possible paths that the lava flow could follow and thus detect the possible threat for the population and infrastructures. Simulations were performed using the VORIS model (Felpeto et al., 2007), which calculate the probability of lava flow invasion based on 3 parameters: topography, lava flow length and thickness. We present here the result for a 20 km long and 3 m thick lava flow. The simulation was performed on the SRTM DEM.
The result shows high probability of lava flow invasion towards north along two main paths. Both paths could affect the road that links the RN2 (Goma-Rutshuru road) to Tongo (Fig. 1 and 2). The most eastern path could affect a part of the Kalengera village. According to the MODVOLC thermal monitoring (http://modis.higp.hawaii.edu), The lava flow could already cross maximum 10 to 12 km northward (Fig. 3).
IMPORTANT: Please, be aware that this simulation is strongly dependent of the input parameters. In the present situation, the currently active lava flow path does not represent a threat for the population.


———-
Information report n°2 – 10th November, 2011
Eruption summary
On 6th November 2011, 5:55 PM (UTC+2), Nyamulagira volcano has started to erupt after two days of intense seismic activity. This eruption is located ± 11 km east of the Nyamulagira main edifice, close to one of the 1989 eruptive sites. The previous eruption of this volcano occurred in January 2010, i.e. 22 months before this event.
Field information
According to seismologists of the Goma Volcano Observatory (GVO), an intense seismic activity was observed since Friday 4th November 2011. This activity was characterized by swarms of both long and short period earthquakes and persisted until the eruption. Since the eruption start, the seismic activity is only characterized by tremors.
Since the beginning of the eruption, field observations are scarce. There is still no information about the length of the lava flow and its evolution.
There is currently no evidence of abnormal activity on Nyiragongo volcano.
Information from remote sensing
MODVOLC (http://modis.higp.hawaii.edu/)
The thermal monitoring of the eruption using MODVOLC allow us estimating the path followed by the lava flow as well as its maximum length. The Figure 1 shows that the lava is flowing northward and already crossed several kilometers after only few days.

NASA Global Sulfur Dioxide Monitoring (http://so2.gsfc.nasa.gov)
Contact: Simon Carn (scarn@mtu.edu)
According to the OMI imagery, a large gas plume was detected over the Virunga volcanoes on 7th November 2011 (Fig. 2). On 9th November, the gas plume already covers a large part of the DR Congo (Fig. 3).


Special acquisitions of Hyperion, ALI, ASTER and ENVISAT-ASAR images have been requested. First acquisitions are scheduled for the end of this week. More information will be available soon.
———-
Information report n°1 – 9th November, 2011
Eruption summary
On 6th November 2011, 17h55 UTC+2, Nyamulagira volcano has started to erupt after two days of intense seismic activity. This eruption is located east of the Nyamulagira main edifice. The previous eruption of this volcano occurred in January 2010, i.e. 22 months before this event.
Field information
According to the Goma Volcano Observatory (GVO), the eruptive center is located ± 11 km east of the Nyamulagira main edifice (29.309° E / 1.4227° S), close to one of the 1989 eruptive sites. The lava is currently flowing northward and does not seem to threaten inhabited areas.
REMARQUE: the true location of the eruptive site has been checked on satellite imagery. It appears that the location provided by the GVO was wrong. The correct location of the eruptive vent is 29.3065° E / 1.3793°S. The true location was used for the lava flow simulations illustrated in the following reports. (16/11/2011 update)
Information from remote sensing
The thermal monitoring system MODVOLC (available online on http://modis.higp.hawaii.edu/) indicates hotspots in the same area reported by the GVO (Fig. 1). These hotspots correspond to thermal emissions from the erupted lava.

Special acquisitions of high resolution SAR and optical satellite images have been requested. First acquisitions are scheduled for the end of this week. More information will be available soon.