2014-04 – Intracrateral activity of Nyamulagira

Index

XXX

Evolution of Nyamulagira’s eruptive activity from April 2012 to March 2014

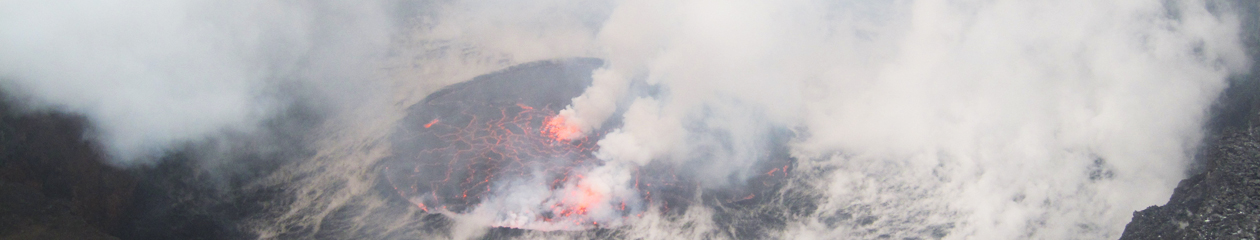
Starting from early March 2012, i.e. in the final stage of the 5 months-long eruption on the NE flank of Nyamulagira, SO2-rich gas fumaroles were observed in the summit caldera of the volcano (D. Tedesco, Pers. Comm.). These fumaroles escaped from several fractures and from the 400 m-wide, 50-80 m deep pit crater located in the NE part of the caldera.

Figure 1: Pléiades satellite image (© CNES, 2012) illustrating the beginning of the collapse in the pit crater located in the NE part of the Nyamulagira’s summit caldera. This image was acquired on 21st January 2012, in tri-stereo mode. The derived topographic profile in frame b highlights this crater collapse. The yellow arrow in frame a indicates the most collapsed part of the pit crater and the beginning its southward extension.
Figure 1: Pléiades satellite image (© CNES, 2012) illustrating the beginning of the collapse in the pit crater located in the NE part of the Nyamulagira’s summit caldera. This image was acquired on 21st January 2012, in tri-stereo mode. The derived topographic profile in frame b highlights this crater collapse. The yellow arrow in frame a indicates the most collapsed part of the pit crater and the beginning its southward extension. Figure (c) B. Smets, RMCA.

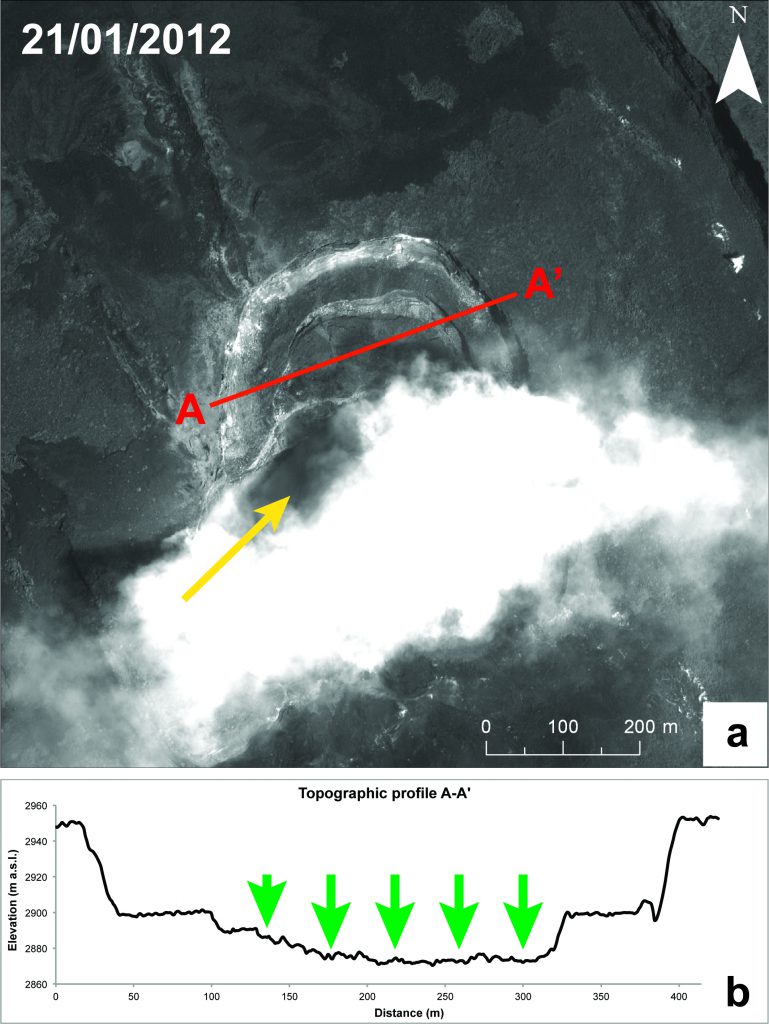
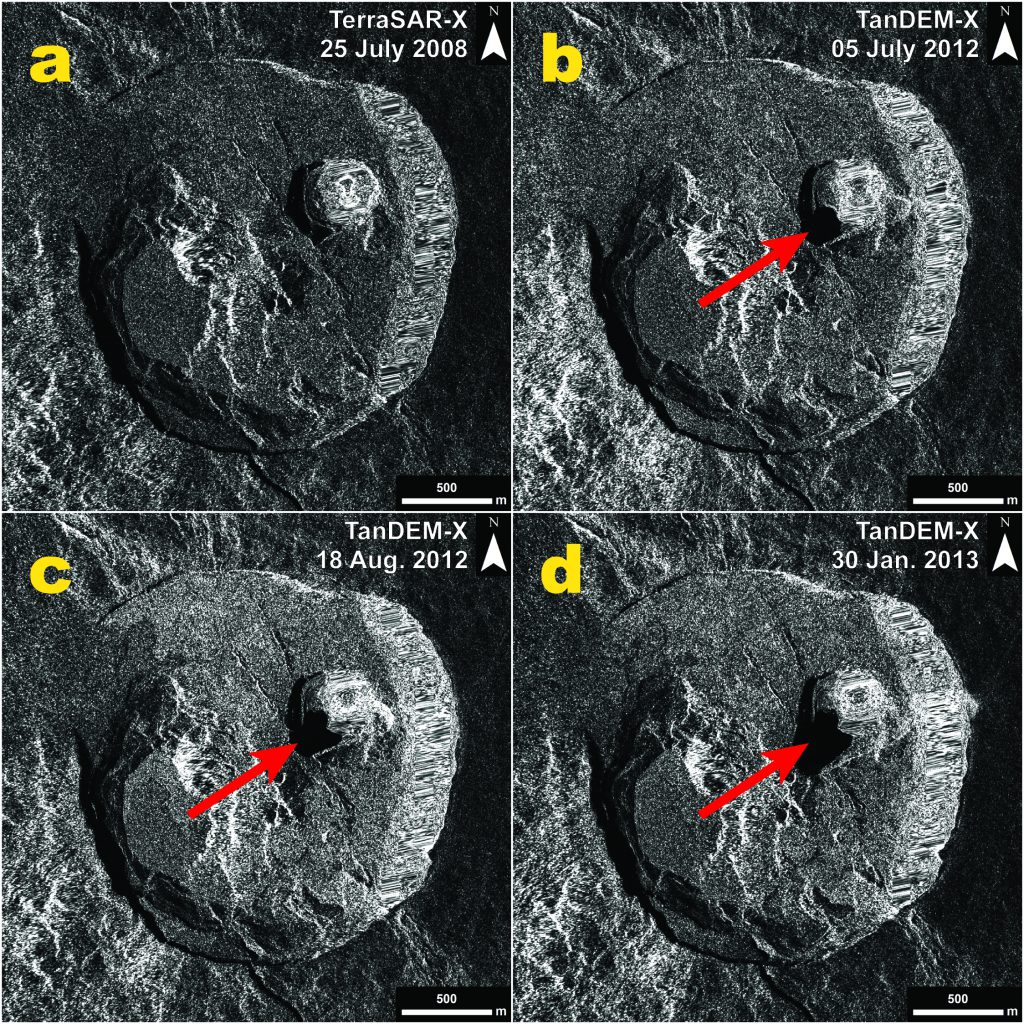
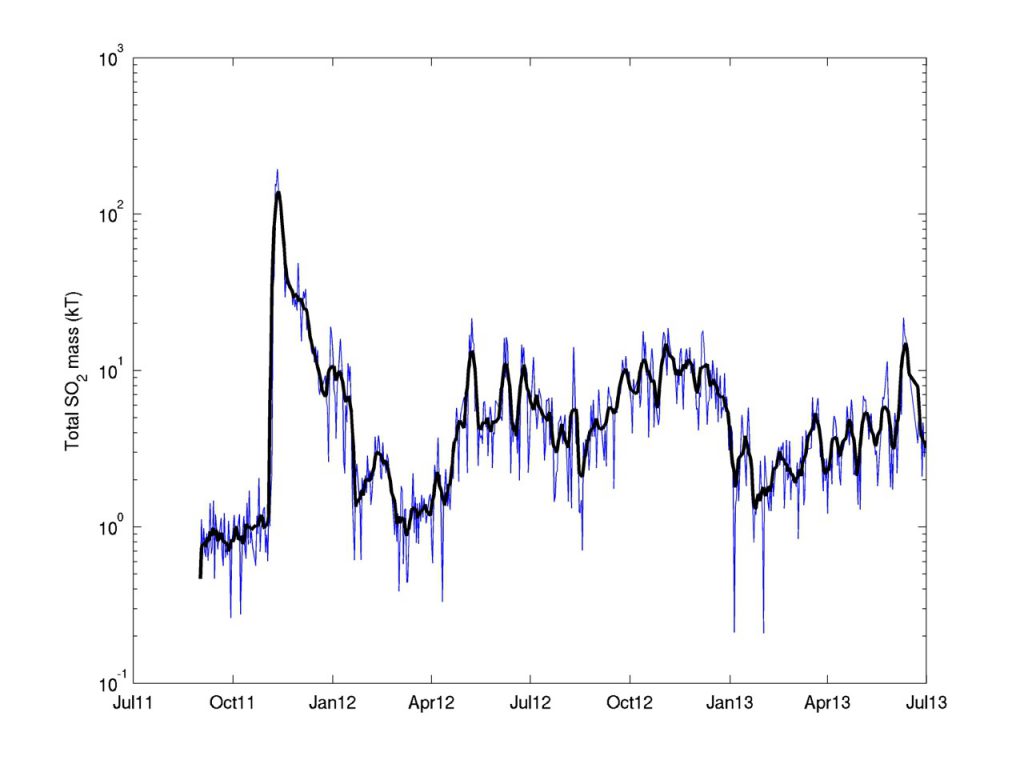
The 2011-2012 eruption of Nyamulagira marked the beginning of the progressive collapse (Fig. 1) and southward extension (Fig. 2) of the pit crater from which the fumarole escaped. During the second half of April 2012, a larger and permanent SO2-rich gas plume started to escape from that pit crater (Fig. 3).

Figure 2: Series of four TerraSAR-X / TanDEM-X (© DLR, 2008-2013) radar amplitude images illustrating the progressive collapse and southward extension of the Nyamulagira’s pit crater. Figure (c) B. Smets, RMCA, and N. d’Oreye, ECGS/MNHN.
Figure 3: Graph of SO2 emissions in the Virunga measured from September 2011 to July 2013 using OMI measurements (© NASA, 2011-2013). The Y-axis is in logarithmic scale. The main peak corresponds to the 2011-2012 eruption of Nyamulagira. Figure (c) N. Theys, BIRA-IASB.

XXX

Evolution of Nyamulagira’s eruptive activity from April 2014 to April 2016

In April 2014, local testimonies reported red glow on top of Nyamulagira. This was accompanied by unusual seismic activity recorded by the Goma Volcano Observatory (GVO). Because of intense degassing, helicopter flights at day and night did not allow detecting any fresh lava at ground surface.

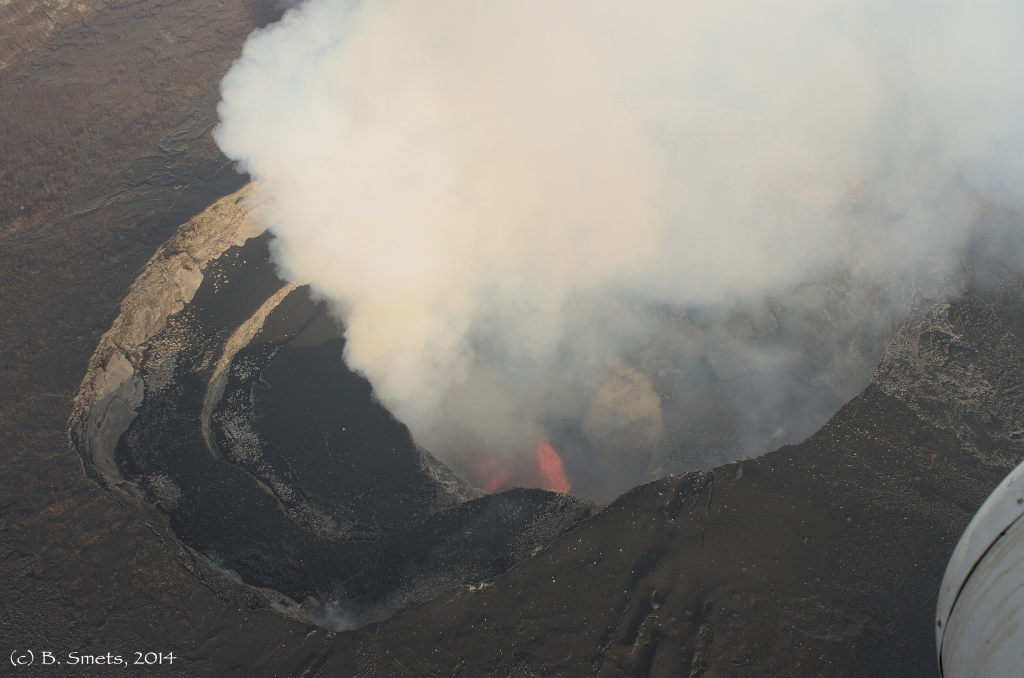
This kind of event reappeared on 22nd June 2014. This time, helicopter flights and field surveys on 1st and 5th July 2014 did allow observing lava fountains escaping from the lowest inner flanks of the now ~500 m-deep and ~400 x 600 m-wide pit crater (Fig. 4; Smets et al., 2014). At that time, lava fountains were not vigorous enough to create and sustain a basin of molten lava in the pit crater. This activity was also characterized by large amounts of SO2-rich gas emissions.

Figure 4: Photo of lava fountaining activity taken from helicopter on 1st July 2014. Photo (c) B. Smets, RMCA.

This activity stopped mid-September 2014 and, on 1st November 2014, a small lava lake, i.e. a small bubbling lava basin, appeared in the deepest section of the pit crater (GVO, Pers. Comm.). The related SO2 emissions appeared lower than during lava fountain activity.

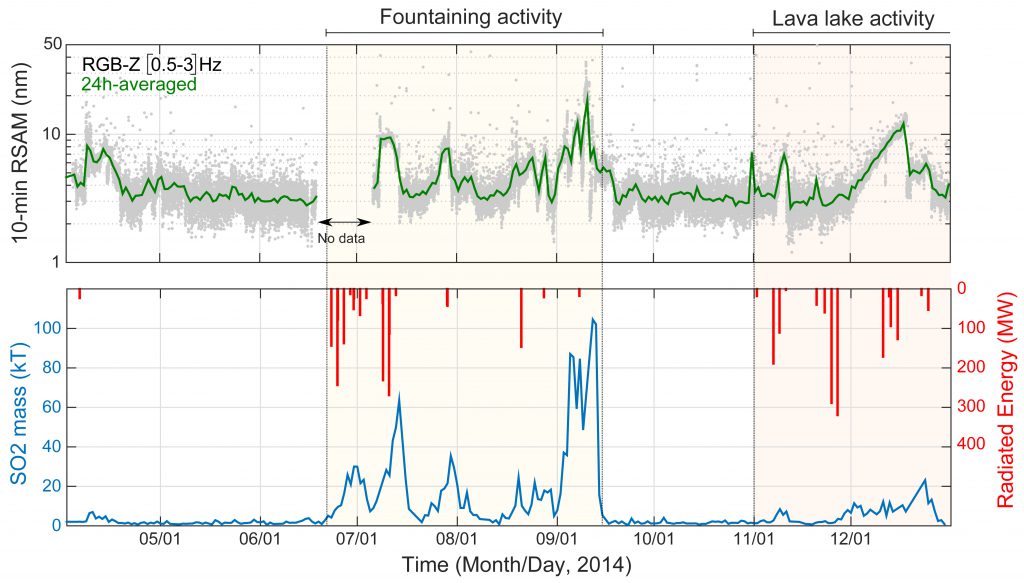
SO2 gas emissions, radiated energy and seismic activity during the April – December 2014 period illustrate very well the evolution of this new activity and the transition from lava fountaining activity to long-lived lava lake activity (Fig. 5).

Figure 5: Graphs illustrating SO2 emissions in the Virunga, radiated energy over Nyamulagira and seismic activity (RSAM) at the Rumangabo station, during the April 2014 – January 2015 period. Total SO2 mass is derived from OMI measurements (© NASA, 2014). Radiated energy is calculated using MODIS imagery (© NASA, 2014) and the MODVOLC algorithm (Wright et al., 2004). RSAM comes from the broadband seismometer of the Rumangabo station (RGB), installed in the framework of the RESIST and RGL-GEORISK projects (Belgian Science Policy Office / Belgian General Direction of the Development Cooperation / National Research Fund of Luxembourg). Figure (c) J. Barrière, ECGS, N. Theys, IASB-BIRA, and B. Smets, RMCA.
Figure 5: Graphs illustrating SO2 emissions in the Virunga, radiated energy over Nyamulagira and seismic activity (RSAM) at the Rumangabo station, during the April 2014 – January 2015 period. Total SO2 mass is derived from OMI measurements (© NASA, 2014). Radiated energy is calculated using MODIS imagery (© NASA, 2014) and the MODVOLC algorithm (Wright et al., 2004). RSAM comes from the broadband seismometer of the Rumangabo station (RGB), installed in the framework of the RESIST and RGL-GEORISK projects (Belgian Science Policy Office / Belgian General Direction of the Development Cooperation / National Research Fund of Luxembourg). Figure (c) J. Barrière, ECGS, N. Theys, BIRA-IASB, and B. Smets, RMCA.

In early April 2016, the GVO staff reported that there was no more lava lake in the pit crater of Nyamulagira. This might be associated with a swarm of long-period earthquakes recorded at that time. According to further observations, lava seems to be close to the surface and is even visible through small spatter cones developed in the pit crater. In late April 2016, the GVO staff reported the reapearance of the lava lake. This intermittence in lava lake activity is similar to what was observed between 1913 and 1938, at the same location in the summit caldera of Nyamulagira.